
Abstract
Over the past decade, more attention to data, quantitative, and critical data literacies in writing studies has led to a variety of approaches for getting students to experiment with data in their writing projects. This article explores an approach combining “data feminism” and “quantitative rhetoric” that asks students to consider data literacy fundamentals, application of intersectional feminism to contextualize understandings of data, and lessons in composing quantitatively in ways to affect social change across multiple rhetorical situations. This approach is illustrated through an upper-division writing class I created called “Data and Writing Toward Social Change” where students reflect about themselves and their data, weigh choices in analyzing data and their consequences, and compose multiple genres of writing for considerations of circulation that assist actionable goals like influencing legislation or organizing a protest.
Keywords
Data science, social justice, feminism, quantitative literacy, quantitative rhetoric
The increasing availability and amount of quantitative data, coupled with the array of calculations that can be performed, has created a need for weighing the benefits and potential harms in the entire rhetorical life of statistics—from collection of data through decisions to communicate analyses of such data. In this article, I detail an upper-division writing class called “Data and Writing Toward Social Change” that explores the rhetorical life of statistics that students create and compose for social justice. More specifically, “data feminism” is foundational to the course’s pedagogy of quantitative writing, which includes analyses of power within datasets, consideration of the uses and limits of data, elevating emotion and embodiment in working with data, rethinking binaries and hierarchies in data collection and interpretations of analyses, and making salient direct lived experience in consideration of contexts of data creation and analysis (D’Ignazio and Klein 17–18).
I work at an institution that consists primarily of working-class, first-generation, non-White college students (mostly Asian and Latinx, followed by Black students). My students, like many college students and people around the world, come from diverse and often marginalized backgrounds. Unfortunately, data about marginalized communities can sometimes be misused or weaponized by those in positions of power, including individuals from privileged backgrounds like my own. When considering the various power dynamics that exist in our classrooms and in the larger world, I argue that writing teachers can think more critically about our conceptions of data and quantitative analysis, together, to equip students to learn socially just approaches to data-driven and quantitative writing. In what follows, I offer a framework and examples that account for how meaning derived from quantitative writing is dependent on living and breathing human beings and, therefore, any such work to create such meaning can have a range of consequences. This highlights the need for a critical attention to all phases of data-driven composition (i.e., data collection, analysis, interpretation, and communication) in its relation to writing for social justice.
In this paper, I first review the literature on calls for three different literacies in writing classrooms and other spaces: data literacy, quantitative literacy, and critical data literacy. Second, I explore my course design and the relevance of data feminism to a socially just quantitative writing pedagogy. In this course, students engage with statistics from the ground up, starting with rhetorical decisions involved in constructing a dataset or database. They then make choices in analysis and alphanumeric writing, culminating in broader considerations of how quantitative arguments circulate to public audiences—examining where, how, and why a statistic can travel. Within that exploration, I analyze student writing from the class to show how students critically thought about data and how their data could be developed and recontextualized as quantitative rhetoric. I then conclude with some thoughts about integrating a data feminist approach to quantitative writing in accessible ways beyond an upper-division writing class (e.g., a first-year writing class, collaborating with departments for interdisciplinary classes).
Moving Toward More Critical Data and Quantitative Literacies in Writing Pedagogies
“Data” has been a key term in the theorization and analysis of writing pedagogies in writing studies for decades. Typically, there have been two strands of attention toward data: in respect to digital technologies influencing various literacies and in respect to methods in the sciences of collecting and analyzing data. There are lots of permeability in these strands (e.g., questioning how decisions in data collection can affect meaning-making in reading and/or writing practices), but I want to make this distinction of strands of attention toward data to show how theorization and analysis of writing pedagogies in the sense of collecting and analyzing data affect a more explicit attention to quantification and quantitative writing.
In the first strand, attention to data relates more directly to technologies of computation and how they interact with digital reading and writing practices in our writing pedagogies. For instance, in various writing studies scholarship data plays a key role in topics such as privacy concerns in digital writing (Beck et al., Critical Digital Literacy”; Beck et al., Writing in the Age of Surveillance; Hutchinson and Novotny), intellectual property (Amidon et al.; Reyman), writing with the effect of algorithmic rhetorics in mind (Bakke; Gallagher, The Ethics of Writing; Gallagher, Writing for Algorithmic Audiences; Koenig), and archival work (Rivard). Forming a “data literacy” for students in this sense often relates to a critical awareness of data to responsibly and effectively read and write in a digital world.
The second strand’s approach allows for student writers to analyze and compose quantitative writing with a critical orientation about the contingency of data. Its primary concerns are with traditional notions of data collection and analysis found in the natural and social sciences. There can be attention to digital literacy here, too, of course. For instance, in an exploration of his class on big data social media analysis to form multimodal, data-driven arguments, Aaron Beveridge sees data literacy within the writing classroom as “an offshoot of digital literacy, focus[ing] on the tools, techniques, and rhetorical practices of data-driven arguments,” which are increasingly reliant on digital technologies (Writing Through Big Data). However, digital technologies need not be a primary focus in this strand.
Beveridge’s position—especially its attention to “data-driven arguments”—is extended from Joanna Wolfe’s earlier call in 2010 for more attention from rhetoricians and compositionists to quantitative literacy and argumentation. Wolfe noticed that despite quantitative writing being “saturated with rhetoric,” little attention in composition textbooks is given to quantitative writing beyond (inaccurately) classifying quantitative information as inartistic proof (Rhetorical Numbers 456–457). To illustrate how quantitative rhetoric relies on artistic rather than inartistic proof, Wolfe shows the simple example of how something like a choice between using a ratio or a percentage to express risk can be rife with rhetorical effects—e.g., a prognosis of a 1 in 50 chance of having a disease vs. a 98% chance of being well (Rhetorical Numbers 459–60). The appeal to pathos through the ratio boils down to this: You might know 50 people and it might not be that hard seeing yourself as the unlucky one of those 50 people whereas you might feel immediate relief that 98% of people are unscathed. Wolfe argues that instructional materials, course designs, and instructor training should dedicate more time and space to teaching quantitative argument (Rhetorical Numbers 456). And, importantly, she notes that this is an attainable goal for writing teachers even if they have some discomfort with mathematical thinking; she says something like eighth-grade math (e.g., arithmetic) is reasonable enough to teach valuable lessons about quantitative writing in composition classrooms (Rhetorical Numbers 455).
Wolfe’s call for increased quantitative literacy in our writing classrooms has been answered by scholars in relation to several contexts: collaboration with mathematics teachers for civic engagement projects (Feigenbaum), integrating quantitative rhetoric with quantitative reasoning in technical communication classes (Colombini and Hum), examining comfort with writing and numbers in STEM students (Nicholes), using distant reading methods and writing about its results on rhetorical analyses (Hoag and Emmerhainz), and a wide range of approaches to teaching data visualization and infographics in the writing and technical communication classrooms (Wolfe, Teaching Students; Pigg, Hannah, and Stone; Laflen; Hanson; Sorapure and Fauni; Danner, Storytelling With and Around Data; Fanning). However, despite lots of room for critical orientations to data, quantitative writing pedagogies are usually limited to traditional statistical ethics (e.g., considering the pros and cons of using a particular statistical method) and/or specific rhetorical forms (e.g., data visualization).
One partial exception to such limitations is Jennifer Bay and Rachel Atherton’s call for a critical data literacy in writing pedagogy, where they highlight the need to “show students the human side of data” (13). Drawing from critical data scholars, Bay and Atherton argue that a critical data literacy requires an omnipresent consideration of social processes at all stages of working with data and that understanding the “process of datafication, where life experiences and human perspectives become data, needs to be at the center of any critical data literacy practices” because only through this understanding “can we work to dismantle and reconstitute practices that silence vulnerable populations” (13). Bay and Atherton recount a service-learning approach where students collect and analyze data in partnership with a non-profit and then argue for the importance of heuristic questioning of the data used by students about how participants are protected and treated with respect, how the data was collected, how data collection was done ethically, how decisions in creating data infrastructure affects accessibility, what stories can and cannot be told, and what the material consequences are for data stories generated (13–14). However, while Bay and Atherton give a lot of excellent attention to a fuller accounting of the process of data collection, analysis, and communication, there is less attention on the specific rhetorical dynamics of quantitative forms of knowing and communication linked to their critical orientation.
Several scholars outside of writing studies have applied a critical data literacy approach to quantitative methodologies more explicitly in ways that can inform writing pedagogies. For instance, in Mathematics Black Life, Katherine McKittrick argues for the pertinence of a critical orientation toward quantitative methodologies regarding Black studies, writing that “archival numerical evidence puts pressure on our present system of knowledge by affirming the knowable (black objecthood) and disguising the untold (black human being)” (16–17). McKittrick asks, “[h]ow do we ethically engage with mathematical and numerical certainties that compile, affirm, and honor bits and pieces of black death?” (18). Her answer is that while “numbers signify measurable items… they also invite chaos” and proposes that a quantitative Black studies embrace the chaos in any “seemingly knowable” version of a “mathematics of blackness and white supremacy” that can help “foste[r] the anti-colonial human being as praxis” (23–24).
Like McKittrick, Maggie Walter and Chris Andersen’s Indigenous Statistics: A Quantitative Research Methodology attempts to step back to think through assumptions of quantitative methodologies and how that affects creation of knowledge—both in general but also especially in Indigenous studies. They identify three premises for using statistical methods in social research that are grounded in values of First World Indigenous peoples from the U.S., Australia, and Canada. The premises are: quantitative methodologies reflect the dominant culture in which they are used (and thus play a role in constituting reality through that cultural lens); that methodologies of collection, analysis, and interpretation more so than methods of statistical analysis shape outputs of quantitative research; and the importance of remaining cognizant of—and careful with—the translation between non-academic knowledges and the work of universities (9–11).
Like McKittrick and Walter and Andersen, in an introduction to a special issue of Race Ethnicity and Education, education scholars Nichole M. Garcia, Nancy López, and Verónica N. Vélez key in on doing humanizing quantitative work that prioritizes lived experience and critical reflection. Doing such work can help “unveil, deconstruct, and transform” oppressive realities faced by people of color through an approach to quantitative work in critical race theory called “QuantCrit” (Garcia, López, and Vélez 152). For Garcia, López, and Vélez (along with other authors in the special issue), use of quantitative methods can be used effectively for racial justice, but only with “ongoing self-reflexivity and engagement with the historical, social, political, and economic structures and power relations at any given point in time” when using such methods (150).
Like the previous examples but in the context of data science, Catherine D’Ignazio and Lauren F. Klein’s Data Feminism puts primacy on the “living, feeling bodies in the world” who are counted and affected by quantitative analysis (73). However, in very accessible fashion relevant to pedagogical approaches, D’Ignazio and Klein consider the entire lifecycle of data—including choices in categorization, data collection, management, analysis, interpretation, and communication–while doing the following throughout that process: examining power, challenging power, elevating emotion and embodiment, rethinking binaries and hierarchies, embracing pluralism, considering context, and making labor visible (17–18).
Together, these examples offer rigorous quantitative methodologies that recognize how statistical information is both shaped by and can reinforce histories of oppression. They respond to these dynamics by incorporating analyses of power and alternative epistemologies to work toward goals of social justice. As a pedagogical resource, D’Ignazio and Klein provide a detailed, hands-on approach that is accessible to a wide range of disciplines and skill levels in working with data. This has been particularly useful in my upper-division writing course, where students come from various majors and have varying levels of comfort with data and quantitative literacy. In the next section, I outline the theoretical underpinnings of my data feminist approach to a quantitative rhetorical pedagogy in more detail.
A Data Feminist Approach to Teaching Quantitative Writing
Data and Writing Toward Social Change is centered around the “statistic” as the central text of consideration. In this section, I begin with an exploration of a statistic as a text. I then write about how data feminism and theorizing of statistics as texts inform my perspective on quantitative writing for social justice.
While a technical definition of a statistic emphasizes “performing a calculation,” thinking about a statistic from a rhetorical perspective emphasizes how statistics are “embedded in words, images, and other means of communication” (Libertz, Evaluating to Persuade 192). Because the line between statistical information and rhetoric may be impossible to delineate, instead it is more useful for writers to think about how “statistical framing” is inevitable. Statistical framing consists of “moves toward evaluation that rhetors make to signal endorsed interpretations of statistical information,” where a quantity is “framed by rhetorical moves that signal an evaluation of that quantity via: the sign of the quantity itself, what the quantity purports to measure, how the quantity is measured, and/or who is doing such measuring” (Libertz, Evaluating to Persuade 192). As Patrick Danner argues in his ethnography of a non-profit, there are always “multiple statistically supportable stories” and the “chosen story is a result of situated realities for the writers and very human choices” (Story/Telling with Data as a Distributed Activity 184). For a public audience, the rhetor must “offer an evaluation of their (hopefully legitimate) statistical interpretation, which is especially important for public rhetoric where the audience may not have the ability, access, or time to do the statistical analysis of the same data themselves” (Libertz, Evaluating to Persuade 193). Thinking about quantitative information in this way helps create a greater focus on the micro-genre of the statistic and its unique cultural status as something that circulates on a large scale.
Thinking about circulation can be helpful for learning about writing with statistics for public audiences due to the nature of statistics as small texts that can spread widely to differing contexts. How the micro-text of a statistic takes on new meanings as it is composed and re-composed in new contexts can help shed light on the entire process of a statistic’s rhetorical life,[1] from data collection through analysis and through its (varied) communication and uptake. Statistics are incredibly mobile because they can be densely packed with meaning. Bruno Latour explains how a statistic is a cascade of collapsing information and materiality; for instance, a census interviewer fills out a form, forms are tabulated into a dataset, calculations are made from this dataset, calculations are performed on those calculations, and so on (234). Materiality is clung to by more and more signs, but also so much is left behind. Latour writes that the ideal of this calculating is to “retain as many elements as possible and still be able to manage them,” turning a large amount of information into smaller inscriptions that travel easily (234). In other words, a semiotic gap from material origins allows a statistic to travel a great distance. Like Latour, Theodore M. Porter explains that the value placed in numbers is due to a material distance, but Porter emphasizes a presumed distance from the interference of human manipulation. Porter writes that quantification is a strategy of communication, a “technology of distance” that “minimizes the need for intimate knowledge and personal trust” (ix). You grab a statistic because you can ostensibly trust the process behind its creation, and then you circulate it forward. For Porter, statistics can be attractive because they are deemed (wrongly) impenetrable by rhetoric and thus can feel like something that travels beyond the touch of a rhetor.
Still, many in the general public almost immediately disbelieve some statistics they encounter. Wolfe notes the paradox that from one perspective “statistical evidence [is represented] as a type of ‘fact’ and therefore immune to the arts of rhetoric,” while from another simultaneous perspective “we are deeply aware and suspicious of the ability of statistics to be ‘cooked,’ ‘massaged,’ ‘spun,’ or otherwise manipulated” (Rhetorical Numbers 453). More simply, Beveridge calls this phenomenon the “deception/fact binary of statistical reasoning” and agrees with Wolfe that students need to get lots of practice making their own arguments from quantitative data to necessarily complicate this binary (Looking in the Dustbin). That is, get their hands dirty with data and numbers a bit. I would add, though, that for working with data and quantification for social justice, students need to slow down in such a way that engages with their own histories and the histories of violence and oppression that surround any data we encounter as part of getting into the dirty work of data preparation and analysis.
Circulation of statistical information should also be considered through its historical lens and its relationship to power. The concepts of biopolitics and biopower can be helpful for such a consideration. For Michel Foucault, biopolitics concern the emerging desire in the 18th century to use then-new understandings of a population as a tool for governing and intervening in political challenges (e.g., understanding birth rates of different groups). Statistics, especially, became useful to, as Porter notes, “turn people into objects to be manipulated” (77). By formulating various categories and various approaches to analyzing data that were created to conform to those categories, and by making deliberate choices in those categorizations and methodologies for analysis, oppressors (e.g., states, capital) can create an abstraction useful to its goals. Accumulations of such statistics in public discourse can help contribute to equating those abstractions with realities, compounding and furthering oppression. As Tukufu Zuberi argues about racial statistics, assumptions behind choices in categorization and analysis of race can help “enshrin[e] and uphol[d] racial hierarchies” (xviii). Extending outward, quantitative ways of knowing can help maintain or further entrench oppressive hierarchies; however, like many technologies, quantitative methods can also be used to challenge oppression.
As D’Ignazio and Klein point out in Data Feminism, data is part of the problem (e.g., surveillance, algorithmic bigotry) but also can be part of the solution (e.g., activist rhetoric to move audiences, flexible and rich ways of understanding social problems) (14–19). Data and quantification can be reductive and wielded to further oppression, but with careful attention to context in its cultivation and framing in its communication, data and quantification can be invaluable for social justice. While this has been true historically (e.g., the quantitative rhetoric of Ida B. Wells; see also Libertz, Amplification by Counterstory), the technological advances of recent decades have greatly increased what is possible in data collection and analysis. D’Ignazio argues elsewhere that the explosion of data production and access over the last decade contains a “profound inequality between those who are benefitting from the storage, collection and analysis of data”—namely: corporations, governments, technocrats, the wealthy—”and those who are not” (6).
Data feminism is “a way of thinking about data, both their uses and their limits, that is informed by direct experience, by a commitment to action, and by intersectional feminist thought” (D’Ignazio and Klein 8). The intersectional feminist thought D’Iganzio and Klein ground data feminism in comes mostly from a Black feminist tradition from thinkers like Kimberlé Crenshaw, bell hooks, and Patricia Hill Collins, culminating in the seven principles of data feminism that organize their book: examine power, challenge power, elevate emotion and embodiment, rethink binaries and hierarchies, embrace pluralism, consider context, and make labor visible (17–18). A data feminist approach helps orient writers toward the context of data—full of potential benefits, harms, limitations, insights, etc.—and how immersing oneself in that context can assist projects of liberation.
One example of applying a data feminist approach to pedagogy is Riccardo Pronzato and Annette N. Markham’s use of “guided autoethnographic analyses of [students’] own lived experience with digital media” during the COVID-19 pandemic in a data literacy course (98). In this approach, students were asked to keep diaries during a “7-day autoethnography challenge” where they responded to different prompts all centered on how daily activities of datafication (e.g., sharing pictures on social media, using GPS on their phones, browsing the internet) reveal how algorithmic media permeates their daily lives (102). While this intervention helped bring about more self-awareness in students, Pronzato and Markham argue that other steps are necessary to maximize agency in students to get them to see how to make changes rather than simply noticing the permeating effects of algorithmic media. They write that their pedagogy also requires “unpacking the black boxes of technology by addressing the basis of data science first conceptually and then more practically” and “building on users’ interests and experiences—if not existing skillsets—of data management and analysis” (111). This approach’s emphasis on building “critical consciousness” through journaling while also giving instruction in “data analytical skills” helps give students both theoretically rich perspectives and concrete ways of working with data to show students how “power relationships are embedded into data and the ways in which privilege and oppression are reiterated through them” (111).
Like Pronzato and Markham, I make a similar move of using a two-step process of building a critical and self-aware orientation in students while pairing it with practical, hands-on work with data. However, in my application of data feminism, I want students to build a critical orientation and get practice with data management and analysis in order to become aware of the nature and consequences of statistics relevant to liberation and oppression that circulate in the public sphere (and, thus, how to participate in that circulation as a reader and a writer). I see statistics as texts that are epistemologically and rhetorically useful for activists and for writers interested in social change. To learn more about using statistics for such a purpose, the connection between critical data literacy (i.e., assumptions driving data to be analyzed) and how to communicate quantitatively in just ways (i.e., explicit interpretation, couching uncertainty, framing with context, prioritizing lived experience and embodiment) are essential in such an approach. And a writing classroom (especially in the upper-division, considering the many goals of a first-year writing course) is an excellent space for students to think critically and get plenty of practice with the murky boundaries of rhetoric, writing, data, and quantification—along with the ethical questions and potential for liberation that comes along with these challenges. By thinking through histories data are embedded in, doing careful preparation and analysis, and then writing for multiple audiences and situations, the aim of my Data and Writing for Social Change course is to follow the life of a statistic from multiple perspectives with the aim to do some good in the world with data. In the next section, I outline my course design using this approach of data feminism combined with quantitative rhetoric.
Data and Writing Toward Social Change Course Design
In this section, I explain the rationale for each unit of Data and Writing Toward Social Change and provide student writing examples from two iterations of teaching this class (this writing is taken from an IRB-exempt study that allowed me to analyze and publish excerpts of student writing from 18 students in total who agreed to participate).
The principles of data feminism that I apply are centered on getting students to see power relationships in their data and how to challenge them, to remember the bodies and emotions present in data and how to utilize them in analysis and communication, to consider and challenge binaries and hierarchies in their data and communications about analyses, and by remembering and accounting for a fuller historical context of violence and oppression when analyzing and communicating about their data. I created the following three units to do this work with students:
- Data Basics and Asking Questions of Data
- Making Quantitative Arguments for Social Justice
- Circulating Quantitative Arguments
The class also had three major projects that correspond with each unit:
- Dataset/Database Critical Biography
- Data-Driven Argument
- Campaign for Circulation
In what follows, I will explain the rationale for each unit, the major assignment for that unit, and provide examples of student writing.
Unit 1: Data Basics and Asking Questions of Data
The first unit was structured in the following way: learning about the basics of data science (e.g., datasets vs. databases, data collection methods, data cleaning) while also applying principles of data feminism to an analysis of our own subject positions and datasets or databases they were thinking about working with. To learn some basics of data science, we did lots of hands-on practice through various workshops to find and explore data while also writing to reflect on the data investigated. Applying the principles of data feminism to this early work with data was helped by the accessibility and ethical grounding of Data Feminism as a book; written for public as well as academic audiences, the book also offers concrete examples that effectively illustrate theoretical principles and applications. More, it is open-access, and indeed, as Lauren E. Cagle explains in a review, the book is “accessible, open, and community-driven” including an “open peer review” feedback mechanism and an “Our Values and Our Metrics for Holding Ourselves Accountable” section that addresses citational politics and more (239).
The unit starts with the student: who they are and what they care about. Much like the autobiographies D’Ignazio and Klein provide in the introduction to Data Feminism, students are asked to think about their own “distinct life trajectories and motivations” for their work through a “Literacy and Numeracy Narrative” where they reflected on who they are, where they come from, and what they wanted to learn in relationship to language, data, and numbers (9). Centering one’s own lived experience helped students turn inward before turning outward toward data collected about other people. Throughout this process, the class was also learning how to find publicly available data (since students were not required to collect their own data, though they were allowed to do so if they wanted to), how to explore data in Microsoft Excel (since this was accessible software they got for free through our university), and key elements of early phases of working with data (e.g., sorting and filtering, cleaning data).
Students were then asked to start thinking about the subject and dataset or database they would like to work with through in-class activities, small scaffolding assignments, and the work on the Dataset/Database Critical Biography (DCB) assignment. In the DCB (split into two parts over about 2–3 weeks of sitting with and reflecting about a dataset or database), students were asked to apply what they were reading in the first few chapters of Data Feminism in short reflective writing pieces responding to the following prompts (there were about 15 prompts overall, so this is a sampling):
- What types of data are in the dataset or database? (i.e., categorical, continuous, discrete, ordinal, binary, qualitative)
- Who created this dataset or database? What are their professional credentials? What organizations are they associated with?
- Who benefits from this collection of data? Name anyone you can think of and explain why they would benefit. Think about the consequences of this data being collected and analyzed—can someone make money off of it? Can someone’s quality of life be improved? Who? How?
- Who might be harmed by this collection of data? Name anyone you can think of and explain why they might be harmed. Think about the consequences of this data being collected and analyzed—can someone experience violence due to this data being collected in this way? What kind of violence (physical, psychic, emotional)? Can someone’s quality of life be impacted negatively by the collection and/or analysis of this data? Who? How?
- What data is missing? What data would offer a fuller understanding of any of the variables? Why? How?
- What “root causes” of problems are important to think about when looking at this data set? Use Patricia Hill Collins’ matrix of domination from Data Feminism to help you think about this question (D’Ignazio and Klein 24–26).
Asking questions like these helps students examine power in the ways that D’Ignazio and Klein focus on, what they term the “who questions” to understand how power operates through data so we can better understand how to challenge it where necessary (47). The DCB provides students an opportunity to sit and reflect on the advantages vs. disadvantages, benefits vs. harms, and a full context of how their dataset or database was created along with what possibilities there are for analyzing it. Here are a few examples for how the DCB impacted student thinking for their later projects:
- In a project using college rankings data, one student criticized the dataset for a few reasons: it contained disproportionately few small schools, little information on financial aid, little information on racial demographics, and it lacked a few large countries despite it being a “global” ranking system.
- A student identified an important caveat in high school dropout data, noting that the dataset was structured in a way that might overlook why English Language Learners drop out. If these students are international, they may have to move back to their home countries at higher rates, leading them to drop out for nonacademic reasons more often than other students.
- A student working on a national dataset about eating disorders noted that types of eating disorders, severity of eating disorder, and a variable on status of treatment being absent might distort interpretations about different cities and states’ capabilities in helping people. For instance, could it be that a city or state has a high percentage of eating disorders because they have a good infrastructure for treating eating disorders that its local population trusts, thus identifying more eating disorders overall?
Having taken the time to reflect on their data over several weeks, students were guided toward decisions in analysis and also for providing important context for interpretation and later writing.
Unit 2: Making Quantitative Arguments for Social Justice
After the DCB assignment, students have a lot to think about as they get ready for analysis: connecting the DCB to analytical and rhetorical choices, completing some descriptive statistical analysis of their data, finding and utilizing secondary sources, and incorporating quantitative rhetorical methods into their writing. The critical reflection of the DCB helps build toward invention of their Data-Driven Argument (DDA) in which students are asked to perform an analysis of their dataset or database and cite data-driven secondary sources to make an argument about a topic relevant to social justice. Here is the structure of the unit:
- Cleaning Data. We start by exploring data cleaning as a form of analysis itself, as data scientist and UX researcher Randy Au argues (i.e., making choices to transform data for different kinds of analysis “imposes values/judgments/interpretations” on that data which is what analysis of any kind ultimately requires).
- Descriptive Statistics. We also spend time on the basics of filtering/sorting, frequencies, measures of central tendency (mean, median, mode), and distributions/variation in sample data. This last item about the distribution of a sample is especially important considering students are not doing inferential statistical analysis (unless they know how to do that from other classes, which a few students have done); such reflection on the limits of writing about a sample from a population without inferential methods can help in writing later while expressing limitations of that analysis.
- Secondary Sources. Students also get time to look for data-driven secondary sources that can help offer more context and evidence to help understand the descriptive statistics they generate from the analysis they perform on their dataset or database. The limits of a descriptive statistical analysis and the work they do in the DCB helps direct their search for secondary sources that can help give them more well-rounded evidence and context surrounding their topic. Furthermore, students were encouraged to capture the lived experience of the people their data is supposed to represent to counter the sometimes alienating and reductive features of academic quantitative data collection and analysis. For instance, one student sought out Indian activist perspectives about water pollution in India rather than rely only on reporting of journalists, technical reports by NGOs, etc.
- Alphanumeric Writing. We then spend time using work from Wolfe (Rhetorical Numbers) to demonstrate the value of pathos and ethos for quantitative rhetoric, the value of emotion and embodiment in writing quantitatively from D’Ignazio and Klein (especially in the use of examples; see chapter 3), Jeanne Fahnestock on rhetorical style (especially methods of amplification; see chapter 18), and the value of communicating context by intentional and direct framing as D’Ignazio and Klein explain (see chapter 6) as well as my concept of statistical framing for things like using examples, voice, and word choice (see Framed and Evaluating to Persuade). Ultimately, we work through how “statistical framing” functions, that numbers are always embedded in rhetoric, and how symbols help to direct readers toward evaluations of the numbers; that is: what do they mean? And why should I care? (Libertz, Evaluating to Persuade). In short, we work on: ways to humanize data and make it matter (e.g., examples), strategic word choice for pathos and ethos, word and syntactic choice to highlight how large or small something is, and added propositions to directly state what matters most and/or what the limitations are.
- Data Visualization. We go through traditional examples of charts and tables while also considering D’Ignazio and Klein’s “data visceralization,” which extends beyond the visual to encompass what “the whole body can experience, emotionally as well as physically” by using color, image, space, animation, text, and other rhetorical tools beyond conventional generic expectations of data visualization (84–85).
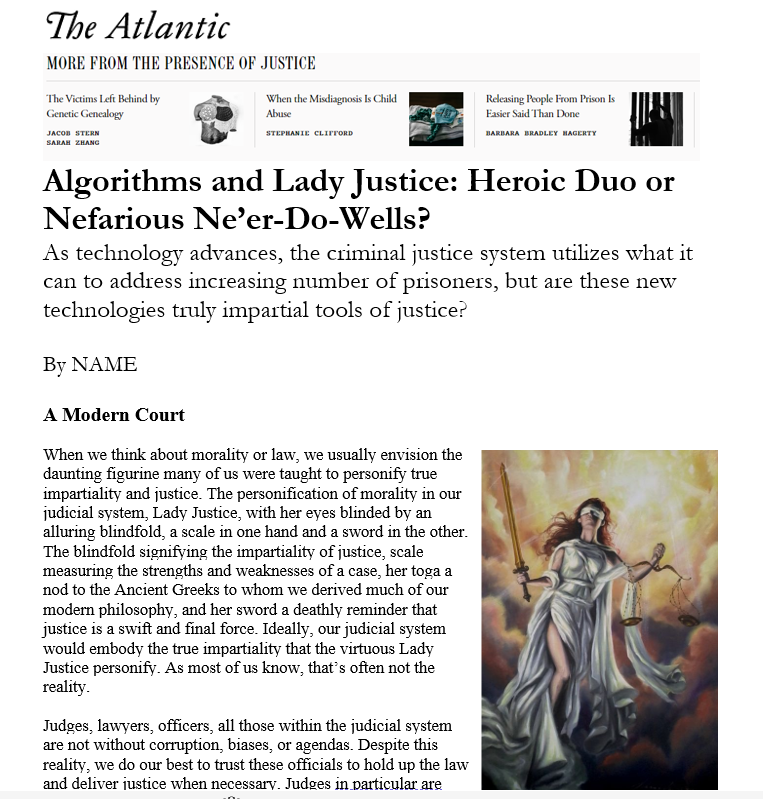
This unit’s aim is to get students to analyze and use writing to work through their understanding and goals of persuasion through an extended argumentative piece (i.e., a choice between a white paper or a long-form journalistic piece in the style of something like The Atlantic or Slate; see Figure 1 and Figure 2). This practice with quantitative writing gets them to really know their data from a perspective of analysis in tandem with creation/collection from the DCB. From a rhetorical perspective, they also start to get practice with how to frame the numbers to make them meaningful for goals of social justice. In the next section, I will provide examples of some of the rhetorical transformations and considerations of context from the DCB and DDA in the final major project, the Campaign for Circulation, which brings lessons from all three units together to follow the journey of critically-oriented, data feminist statistics.
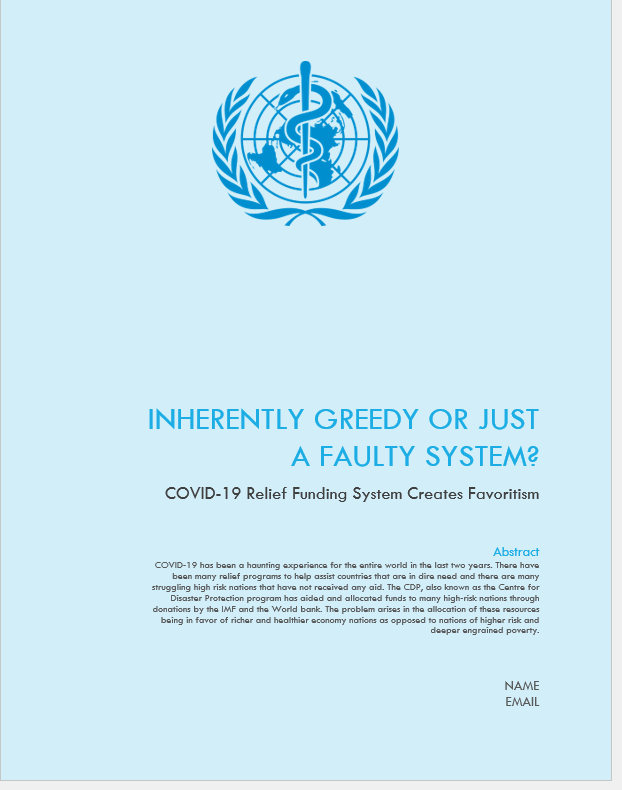
Figure 1. First Page of White Paper Version of DDA.
Figure 2. First Page of Long-Form Journalistic Piece of DDA.
Unit 3: Circulating Statistics
The third unit brings together the previous two units through the creation of a public campaign intervening in a social issue. The first unit helps students slow down with their data, to really sit with what it is, consider how it was created, who created it, what its possibilities are, what its limitations are, and what consequences it can bring in terms of benefits and harms. The second unit asks students to perform statistical analyses of their data, to use that perspective gained in unit 1 to add context to an analysis of their data and its interpretation, to learn more about their topic through secondary research, and to begin to apply some quantitative rhetorical techniques that help frame the statistics they generate themselves and cite from others in their DDA assignment. Finally, unit 3 brings the first two units together through deliberate re-framing of the statistics they critically generated in unit 2 for new rhetorical situations in their Campaign for Circulation (CfC) assignment. This fuller process, imbued with reflection on power and consequences throughout, stays tethered to goals of social justice.
The CfC assignment asks students to consider “rhetorical velocity” (i.e., composing with re-composition in mind) as they compose statistical information for public genres that are strategically planned for audiences they would like to reach on behalf of an organization of some kind (e.g., non-profit, government agency, community or activist group) (Ridolfo and DeVoss). Students write a proposal to that organization that explains their goals for the campaign (e.g., inform, influence legislation, organize a protest), their primary and secondary audiences, data-driven texts they will compose (they must contain quantitative information), and two “prototypes” of those texts in which they actually compose examples of those texts. Examples of texts include, but are not limited to: flyers, Twitter threads, Instagram posts, memes, YouTube videos, short opinion pieces in online or print newspapers, infographics, billboards. Students are encouraged to think about ways to use genres that circulate widely and can be taken up memorably by audiences so the statistic spreads further. This assignment helps to complete the journey of a statistic generated through a data feminist orientation with multiple audiences and rhetorical situations in mind. Below, I share examples of statistical writing students composed both from their DDA and CfC assignment and my own commentary on their choices in statistical framing.
Black Head Coaches in the NFL
DDA example: “There are over 60% of African Americans as players, 30% of African Americans as assistant head coaches, and only 10% of African American head coaches are in the NFL as of 2018–2019.” (Data from TIDES: The Institute for Diversity and Ethics in Sport)
My commentary on DDA: The writer uses a method of amplification for quantitative rhetoric by series construction and comparison. He starts with a large number to talk about Black players in the NFL, then halves it with Black assistant coaches, and then it diminishes further to focus on percentage of Black head coaches, which is the focus of the DDA paper. Amplification by comparison takes place especially through the large proportion of Black players vs. the relatively small proportion of Black coaches.
CfC Meme:

Figure 3. Meme about Black Head Coaches in the NFL.
My commentary on CfC prototype: The student taps into emotion and embodiment by using a familiar and humorous meme where the man in the picture talks about the rent being “too damn high” and re-composes it for these proportions that he explains are too low. This move helps make the racism in coaching hiring decisions stand out for audiences who could be scrolling through their social media feeds.
Public Health and Vaccine Inequity
DDA Example: “According to Our World in Data, roughly 35% of the population in the United States has received at least one dose of the vaccine and more than 60% of the population in Israel has received one dose of the vaccine, but if you look at the entirety of Africa, only 0.65% of the population has received a dose of the vaccine and in Asia only 2.65% of the population.” (Data from Our World in Data)
My commentary on DDA: In a white paper about international inequity related to public health during the COVID-19 pandemic in spring 2021, this student amplifies by comparison in beginning with the US and Israel’s percentage of vaccinated population, before contrasting with the “entirety of Africa” and Asia (which amplifies by heightening, going from country to continent) with much lower percentages. The choice to bold in a longer technical report also helps direct reader attention to these contrasts.
CfC Data Visualization:
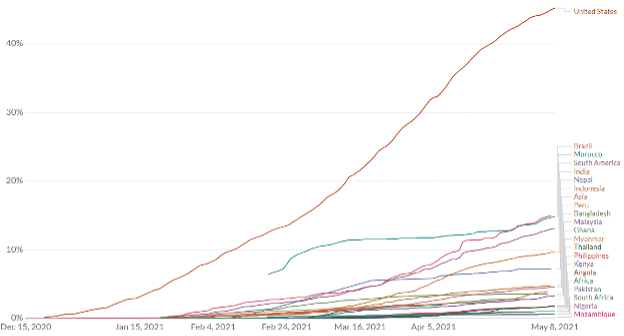
My Commentary on CfC Data Visualization: The student generated this visualization from Our World in Data for 2020-spring 2021, where he chose regions and nations categorized as “high risk” compared to the U.S. in terms of percentage of the population that received at least one dose of COVID-19 vaccine. The contrast of a single nation against many regions/nations also helps to illustrate hoarding of resources in a whiter, Western country compared to browner, poorer regions in the Global South, which contributes to the larger argument the student is making. The student wrote about how he wanted to utilize this visualization for a planned webinar on public health inequities.
Race, Material Conditions, and Mental Health
DDA Example:
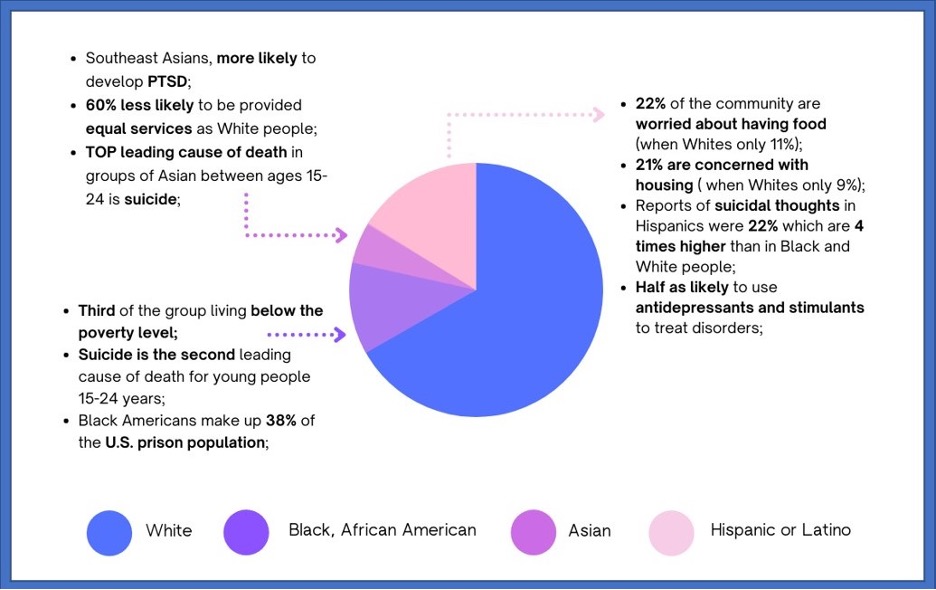
One example sentence from the white paper: “Southeast Asians, especially refugees, are more likely to develop and later report post-traumatic stress disorder associated with immigration experiences.” (Data from American Psychiatric Association fact sheets on different racial groups, Centers for Disease Control and Prevention, Mental Health America, U.S. Department of Health and Human Services, and Reuters)
My Commentary on DDA: Use of color, bolding, arrows, and a border to surround the image helps draw attention to different statistical information about racial disparities and mental health (arrows notably helpful for accessibility, as meaning is not reliant on color). The image is also used as a starting point to get into more detailed information about race and mental health. For instance, in the sentence I pulled out above, more information is included about Southeast Asians as more likely than White people to develop PTSD; these experiences are associated with immigration, especially for refugees. The student is paying attention to going beyond monolithic racial categories and seeking out quantitative information that reveals more necessary context.
CfC Rationale for Use of Image: The student also thought carefully about how this image could be circulated. In their CfC, they explain that the image “will be shared on print billboards across the country, places like subway ads, and bus stops” because “people tend to observe more in these places or wherever it requires for them to take a pause and look around.” The student cites a study they found in a secondary source that showed that 71% of people “often look at the messages on roadside billboards (traditional and digital combined) and more than one-third (37%) report looking at an outdoor ad each or most of the time they pass one” (Olenski).
My Commentary on CfC Rationale for Use of Image: Here the student thinks carefully about the best locations for her data visualization and the genre best suited for those locations when considering her goals and audiences (i.e., she wants to bring awareness to various non-White groups about connections between mental health and racialized, material conditions). Using secondary research to help her make decisions shows good awareness of relying on others beyond the writer’s own intuition to make rhetorical decisions.
In each of these examples, students are thinking from a micro-perspective of how to compose quantitatively in ways that draw attention to the meaning of the number that they want audiences to focus on, they are honoring the context and humanity of who is measured and who is in the audience, they are paying attention to embodiment, and they are also focusing on how to circulate these texts to new contexts. They are also applying these principles of data feminism to a larger rhetorical life of a statistic for multiple contexts since the beginning of the semester: starting with creation and collection of data, then data management, followed by analysis and interpretation, and ending with composing and re-composing statistics for different contexts.
Conclusion
The goal of the class is to help humanize the analysis students conduct and to then think deeply about the rhetorical choices they have at their disposal to write different versions of their quantitative arguments for social justice in different rhetorical situations. Ideally, the class can help students avoid quick, uncritical wielding of quantitative arguments (e.g., a quick google search to copy/paste a statistic into a paper) and to think more about the benefits, harms, and rhetorical flexibility for composing and framing quantitative information to have an impact for good. Quantitative writing pedagogies need not look exactly like the one presented in this article, but any attention to students working with data, especially when it comes to public writing and social justice, should make room for consideration of who and what is being measured, how that measurement is conducted, and what steps students and instructors can take to compose throughout the rhetorical life of statistics.
Such work can be done in an entire class or this work (or aspects of it) could be limited to smaller goals in individual activities or assignments. For instance, in a first-year writing class with a gender and sexuality theme, Stacey Waite asks her students to write an essay after reviewing a section of Michael Warner’s The Trouble with Normal: Sex, Politics, and the Ethics of Queer Life where Warner interrogates the use of statistics and its association with “normalcy” (175). Waite asks her students to note 8–12 quotes that call their attention to something “specific (maybe something you had never thought of) about statistics” and then to have the sheet of quotes beside them while they find statistics about “sex, gender, or sexual behavior, etc.” that “reflect or seem to be in conversation with Warner” (175). Waite asks students to address these questions: “What do the statistics want you to believe? How can you tell? What kind of language is used to talk about the statistics? How do you put these statistics into conversation with Warner?… Finally, has Warner changed the ways you imagine what statistics do, or what they are?” (175).
Waite excerpts a student essay that reaches many similar goals I have for my own students: considering power dynamics in data, who benefits and who is harmed, and how statistics depend on statistical framing toward a specific set of goals. The student considers the goals of The National Coalition for the Protection of Children and Families and how they benefit from sharing statistics about cohabitation, pornography use, and other topics to help argue for the “health” of the heterosexual, nuclear family (176–177). The student also criticizes what is missing in the presentation of the data (e.g., a definition of “addiction” to pornography, further explanation of the correlation of different levels of the defined addiction to concrete negative outcomes on families). The student picks up on the nature of statistical framing: “The statistic itself… does no work in creating or supporting morals—it is only a measurement of what some people say they do” (177, emphasis in original). She concludes that she is “skeptical” of statistics but “not necessarily of the statistics themselves, but of how people use them, why they’re using them, and what they’re trying to make me think by using them” (177). This is an assignment that cannot make time for finding or collecting data, carrying out analyses, and so on. But it excellently demonstrates that a data feminist approach to quantitative rhetoric is achievable on even small scales in a writing class.
One limitation in my approach in Data and Writing for Social Change is that this is a writing class and not a statistics or data science class. I can’t expect my students to have any facility or familiarity with inferential statistics, computation, etc. which is why I did things like limit expectations to calculating descriptive statistics and to using Microsoft Excel since I had a reasonable expectation that students were familiar with that program. A good goal going forward would be collaboration with other departments to better integrate quantitative writing and rhetoric with quantitative reasoning across the curriculum as other scholars have argued for (Rutz and Grawe; Colombini and Hum), but especially to do this from a critical data literacy or data feminist standpoint. Co-teaching or sequencing classes across departments and multiple ongoing projects could be a promising goal for combining access to data science, quantitative communication, and critical data literacy for students and a world that needs it. However, any steps, large or small, that make efforts to link data feminist or similar approaches to quantitative reading and writing practices can help give students perspectives on literacy and rhetoric that can, as D’Ignazio puts it, “speak data” in ways that can help “transform (not just reproduce) the status quo” (15).
Acknowledgments
Thank you to the CUNY Faculty Fellowship Publication Program for help with this project, especially my readers: Jennifer Caroccio Maldonado, I. Augustus Durham, Jonathan W. Gray, Vivian Lim, Sandy Plácido, and Laura Schrier Rifkin. I also wanted to thank Cory Holding, Joanna Wolfe, Annette Vee, and Stephen L. Carr for feedback on an earlier version of this project. Finally, thank you to Les Hutchinson Campos for the recommendation to read Indigenous Statistics.
Notes
[1] In his dissertation, Micah Christopher Wright also uses the term “rhetorical life” in relation to statistics. His usage focuses on “elements of discourse in a circulating rhetoric” after the calculation of any one statistic has been performed and within a historical and social context (19). Like Wright, I also consider circulation as part of the rhetorical life of a statistic. However, I focus more on looking “under the hood” of the statistic to see its relation to data creation, collection, management, analysis, interpretation, communication, uptake, and so on to think about power, oppression, and liberation in relation to critical data and quantitative literacies. In this sense, the “rhetorical life” begins with data, where much rhetorical work in that data has ties to many different kinds of social relations (and various relations to power) prior to the existence of any one statistic.
Works Cited
Amidon, Timothy R., et al. Copyright, Content, and Control: Student Authorship Across Educational Technology Platforms. Kairos: A Journal of Rhetoric, Technology, and Pedagogy, vol. 24, no. 1, 2019, https://kairos.technorhetoric.net/24.1/topoi/amidon-et-al/index.html.
Au, Randy. Data Cleaning IS Analysis, Not Grunt Work. Counting Stuff, 15 Sept. 2020, https://counting.substack.com/p/data-cleaning-is-analysis-not-grunt.
Bakke, Abigail. Everyday Googling: Results of an Observational Study and Applications for Teaching Algorithmic Literacy. Computers and Composition, vol. 57, 2020, p. 102577. https://doi.org/10.1016/j.compcom.2020.102577.
Bay, Jennifer, and Rachel Atherton. Rhetorics of Data in Nonprofit Settings: How Community Engagement Pedagogies Can Enact Social Justice. Computers and Composition, vol. 61, 2021, p. 102656. https://doi.org/10.1016/j.compcom.2021.102656.
Beck, Estee, et al. Critical Digital Literacy as Method for Teaching Tactics of Response to Online Surveillance and Privacy Erosion. Computers and Composition, vol. 61, 2021, p. 102654. https://doi.org/10.1016/j.compcom.2021.102654.
Beck, Estee N. Writing Educator Responsibilities for Disucssing the History and Practice of Surveillance and Privacy in Writing Classes. Kairos: A Journal of Rhetoric, Technology, and Pedagogy, vol. 20, no. 2, 2016, https://kairos.technorhetoric.net/20.2/topoi/beck-et-al/beck.html.
Beveridge, Aaron. Looking in the Dustbin: Data Janitorial Work, Statistical Reasoning, and Information Rhetoric. Computers and Composition Online, vol. Fall 2015, 2015, http://cconlinejournal.org/fall15/beveridge/.
———. Writing through Big Data: New Challenges and Possibilities for Data-Driven Arguments. Composition Forum, vol. 37, 2017, http://compositionforum.com/issue/37/big-data.php.
Cagle, Lauren E. Book Review of D’Ignazio, C., & Klein, L. F. (2020). Data Feminism. The MIT Press. The Journal of Writing Analytics, vol. 4, no. 1, 2020, pp. 237–42. https://doi.org/10.37514/JWA-J.2020.4.1.11.
Colombini, Crystal Broch, and Sue Hum. Integrating Quantitative Literacy into Technical Writing Instruction. Technical Communication Quarterly, vol. 26, no. 4, 2017, pp. 379–94. https://doi.org/10.1080/10572252.2017.1382259.
Coronavirus (COVID-19) Vaccinations. Our World in Data. https://ourworldindata.org/covid-vaccinations.
Danner, Patrick. Storytelling With and Around Data. Kairos: A Journal of Rhetoric, Technology, and Pedagogy, vol. 25, no. 1, 2020, https://kairos.technorhetoric.net/25.1/index.html.
———. Story/Telling with Data as Distributed Activity. Technical Communication Quarterly, vol. 29, no. 2, 2020, pp. 174–87. https://doi.org/10.1080/10572252.2019.1660807.
D’Ignazio, Catherine. Creative Data Literacy: Bridging the Gap between the Data-Haves and Data-Have Nots. Information Design Journal, July 2022, pp. 6–18. https://doi.org/10.1075/idj.23.1.03dig.
D’Ignazio, Catherine, and Lauren F. Klein. Data Feminism. MIT Press, 2020.
Fahnestock, Jeanne. Rhetorical Style: The Uses of Language in Persuasion. Oxford University Press, 2011.
Fanning, Shannon N. Following the Narrative: Using Data Visualization in the Composition Classroom. Kairos: A Journal of Rhetoric, Technology, and Pedagogy, vol. 25, no. 1, 2020, https://praxis.technorhetoric.net/tiki-index.php?page=PraxisWiki%3A_%3AUtilizing+data+visualization#Following_the_Narrative\:_Using_Data_Visualization_in_the_Composition_Classroom.
Feigenbaum, Paul. Rhetoric, Mathematics, and the Pedagogies We Want: Empowering Youth Access to Twenty-First Century Literacies. College English, vol. 77, no. 5, 2015, pp. 429–49.
Foucault, Michel. Security, Territory, Population: Lectures at the Collège de France 1977–1978. Palgrave, 2007.
Gallagher, John R. The Ethics of Writing for Algorithmic Audiences. Computers and Composition, vol. 57, 2020, p. 102583. https://doi.org/10.1016/j.compcom.2020.102583.
———. Writing for Algorithmic Audiences. Computers and Composition, vol. 45, 2017, pp. 25–35. https://doi.org/10.1016/j.compcom.2017.06.002.
Garcia, Nichole M., et al. QuantCrit: Rectifying Quantitative Methods through Critical Race Theory. Race Ethnicity and Education, vol. 21, no. 2, 2018, pp. 149–57. https://doi.org/10.1080/13613324.2017.1377675.
Hanson, Valerie L. Performing Data and Visualizing Difference: Developing a Performative Rhetoric of Infographics for the Writing Classroom. College Composition and Communication, vol. 73, no. 3, 2021, pp. 465–92.
Hart, Samuel. The Race Gap: How U.S. Systemic Racism Plays out in Black Lives. Reuters, 14 July 2020, https://graphics.reuters.com/GLOBAL-RACE/USA/nmopajawjva/#life-expectancy.
Hoag, Trevor, and Nicole Emmelhainz. Learning to Read Again: Introducing Undergraduates to Critical Distant Reading, Machine Analysis, and Data in Humanities Writing. Composition and Big Data, edited by Amanda Licastro and Miller Benjamin, University of Pittsburgh Press, 2021, pp. 22–34.
How Race Matters: What We Can Learn from Mental Health America’s Screening in 2020. Mental Health America, 2021, https://mhanational.org/mental-health-data-2020.
Hutchinson, Les, and Maria Novotny. Teaching a Critical Digital Literacy of Wearables: A Feminist Surveillance as Care Pedagogy. Computers and Composition, vol. 50, 2018, pp. 105–20. https://doi.org/10.1016/j.compcom.2018.07.006.
Koenig, Abby. The Algorithms Know Me and I Know Them: Using Student Journals to Uncover Algorithmic Literacy Awareness. Computers and Composition, vol. 58, 2020, p. 102611. https://doi.org/10.1016/j.compcom.2020.102611.
Laflen, Angela. Quantitative Literacy in the Composition Classroom: Using Infographics Assignments to Teach Ethical and Effective Data Use. Literacy and Pedagogy in an Age of Misinformation and Disinformation, edited by Tara Lockhart et al., pp. 34–58.
Lapchick, Richard. The 2019 Racial and Gender Report Card: National Football League. TIDES: The Institute for Diversity and Ethics in Sport, October 30, 2019.
Latour, Bruno. Science in Action: How to Follow Scientists and Engineers through Society. Harvard University Press, 1987.
Libertz, Daniel. Amplification by Counterstory in the Quantitative Rhetoric of Ida B. Wells. Rhetoric Society Quarterly, vol. 51, no. 4, 2021, pp. 309–24. https://doi.org/10.1080/02773945.2021.1947514.
———. Evaluating to Persuade in Statistical Framing: A Conceptual Tool for Rhetors and Audiences. The Routledge Handbook of Language and Persuasion, edited by Jeanne Fahnestock and Randy Allen Harris, 2023, pp. 190–206.
———. Framed for Lying: Statistics as In/Artistic Proof. Res Rhetorica, vol. 5, no. 4, 2018. https://doi.org/10.29107/rr2018.4.1.
McKittrick, Katherine. Mathematics Black Life. The Black Scholar, vol. 44, no. 2, 2014, pp. 16–28. https://doi.org/10.1080/00064246.2014.11413684.
McKnight-Eily, Lela et al. Racial and Ethnic Disparities in the Prevalence… Centers for Disease Control and Prevention, 4 Feb. 2021, www.cdc.gov/mmwr/volumes/70/wr/mm7005a3.htm.
Mental and Behavioral Health – African Americans – The Office of Minority Health. The U.S. Department of Health and Human Services, 2021, https://minorityhealth.hhs.gov/omh/browse.aspx?lvl=4&lvlid=24#1.
Mental Health Disparities: Diverse Populations. American Psychiatric Association, 2017, https://www.psychiatry.org/psychiatrists/cultural-competency/education/mental-health-facts.
Nicholes, Justin. The Relationship between Comfort with Writing and Comfort Working with Numbers in STEM. Journal of Academic Writing, vol. 11, no. 1, 2021, pp. 92–106. https://doi.org/10.18552/joaw.v11i1.658.
Olenski, Steve. Does Outdoor Advertising Still Work? Forbes, 10 Oct. 2011, www.forbes.com/sites/marketshare/2011/10/10/does-outdoor-advertising-still-work/?sh=3386600874a8.
Pigg, Stacey, et al. Teaching Information Design That Emphasizes Data: Revisiting Professional Writing Outcomes and Assignments. Proceedings of the 36th ACM International Conference on the Design of Communication, ACM, 2018, pp. 1–7. https://doi.org/10.1145/3233756.3233957.
Porter, Theodore M. Trust in Numbers: The Pursuit of Objectivity in Science and Public Life. Princeton University Press, 1995.
Pronzato, Riccardo, and Annette N. Markham. Returning to Critical Pedagogy in a World of Datafication. Convergence: The International Journal of Research into New Media Technologies, vol. 29, no. 1, 2023, pp. 97–115. https://doi.org/10.1177/13548565221148108.
Reyman, Jessica. User Data on the Social Web: Authorship, Agency, and Appropriation. College English, vol. 75, no. 5, 2013.
Ridolfo, Jim, and Dànielle Nicole DeVoss. Composing for Recomposition: Rhetorical Velocity and Delivery. Kairos: A Journal of Rhetoric, Technology, and Pedagogy, vol. 13, no. 2, 2009, https://kairos.technorhetoric.net/13.2/topoi/ridolfo_devoss/velocity.html.
Rivard, Courtney. Turning Archives into Data: Archival Rhetorics and Digital Literacy in the Composition Classroom. College Composition and Communication, vol. 70, no. 4, 2019, pp. 527–59.
Sorapure, Madeleine, and Austin Fauni. Teaching Dear Data. Kairos: A Journal of Rhetoric, Technology, and Pedagogy, vol. 25, no. 1, 2020, https://kairos.technorhetoric.net/25.1/praxis/sorapure-fauni/index.html.
Waite, Stacey. Teaching Queer: Radical Possibilities for Writing and Knowing. University of Pittsburgh Press, 2017.
Walter, Maggie, and Chris Andersen. Indigenous Statistics: A Quantitative Research Methodology. Routledge, 2013.
Warner, Michael. The Trouble with Normal: Sex, Politics, and the Ethics of Queer Life. The Free Press, 1999.
Wolfe, Joanna. Rhetorical Numbers: A Case for Quantitative Writing in the Composition Classroom. College Composition and Communication, vol. 61, no. 3, pp. 452–75.
———. Teaching Students to Focus on the Data in Data Visualization. Journal of Business and Technical Communication, vol. 29, no. 3, 2015, pp. 344–59. https://doi.org/10.1177/1050651915573944
Wright, Micah Christopher. The Rhetorical Life of 22-A-Day: Discourse, Media Publics, and Representation. 2021. The University of Texas at San Antonio. PhD dissertation.
Zuberi, Tukufu. Thicker than Blood: How Racial Statistics Lie. University of Minnesota Press, 2001.